Tuesday, June 15, 2021

Spring4D 2.0 sneak peek - the evolution of performance

To be honest - most of the collections in Spring 1.2 are dead slow - especially on Win32. But to be fair, almost nobody complained about that so far. Now that we have some shiny tool to print some numbers here are some simple benchmarks - they show a similar pretty sad picture for almost every method as most of them are virtual in 1.2.

The benchmark simply measures how long it takes to add n integers to a list with a pre-allocated capacity - so this is just the duration it takes to call and stuff that integer into the internal array (and whatever else is going on) - compiled with 10.4.2 - Win32 release. You can see how hard that return stack buffer trashing hits the performance here.


The numbers for Win64 are a little less terrible but still far from good:


Now fast forward to the latest development state - Win32:


and Win64:


Before you ask - well - simply adding Spring4D to the binary makes the RTL faster or slower! No, seriously, that was a joke. You can see the effect that Professor Berger mentioned in his talk that I linked in my last blog post. So be careful with these numbers. Simply flipping some bit in your binary can affect completely unrelated code.

However, the important point here and one that is consistent regardless of the relative numbers is the improvement from 1.2 to 2.0 and this goes for all collections across the board regarding 3 key factors:

1. speed - there are no virtual methods anymore behind the interfaces, the lists are optimized to perform the fastest way possible especially when there are no OnChanged event handlers attached to them which is the common case and where you want the pure speed.

2. binary size - as you know generics can cause quite a huge chunk of binary code because for every specialization the code is basically duplicated even for binary identical types including their RTTI. In 2.0 all RTTI for the implementing classes which you will never touch anyway is turned off and with some trickery, many generic specializations are folded and forced into the Spring.Collections.dcu to not pollute each and every dcu you compile a list or dictionary into. And it does not only shrink your binary, but also speeds up your compilation as the compiler simply has less work to do - no generating code (RTTI and executable code) into dcu which the linker later has to go through and eliminate duplicates.

3. instance size - while it certainly does not matter if a list instance itself is 58byte or 80byte when you store thousands of integers or objects in them it can make a difference if you have many of those lists for example in every data object and each of them only holds a handful of items. Due to field reordering and implementing the interfaces on one class instead of on multiple ones this saves a few bytes for every instance as those interfaces that inherit from each other such as IList<T> inherits from IEnumerable<T> those share the same IMT slot in every object instead of occupying each their own. On 64bit this saving is even bigger due to the doubled size for pointers as you can imagine.


2.0 will provide the perfect balance between the first two points - providing the best speed while keeping the binary bloat low and providing a rich and powerful API as you already know and love it including some valuable additions.


While the development of 2.0 is still going on it is close to completion - currently, I am working on finalizing the refactoring of our dictionary which as you might know was the last collection type that was simply a wrapper around the RTL in 1.2. But more about that in the next article.

For now just a benchmark of different dictionary lookups - the match rate is 100% in these benchmarks which means all lookups are successful - yup, that's roughly a 4-7 times improvement over the RTL!


Monday, June 14, 2021

Introducing Spring.Benchmark - a port of Google benchmark

Some while ago I expressed the wish for someone to create a wrapper for the famous Google benchmark library. It is a library to write so-called microbenchmarks. Microbenchmarks can help to tune small parts of code such as functions or classes. While you can certainly measure code by simply using QueryPerformanceCounter or TStopwatch there is more to a microbenchmark than simply running your code a couple times and stopping the time.

Usually, such libraries make sure the code you want to measure has a warm-up phase before it actually gets measured. And also apart from simply printing some duration that it took a good library can provide more information such as running the code multiple times with different parameters and calculate meaningful statistics for example an estimated efficiency of the measured code.

If you are a regular visitor of Delphi-PRAXiS you might have seen several threads where the performance of different functions and algorithms have been discussed. Most of them have the more simple character of measuring the code of a couple of runs with a stopwatch and often don't do any statement about their asymptotic behavior.

Before we look into what Spring.Benchmark is and offers a little disclaimer: micro benchmarking is something you don't do constantly and you need to be aware that it is one of the many tools at our disposal. Also, be aware of the traps that microbenchmarks hold and take its results with a grain of salt. For more information, I really suggest you watch this interesting and entertaining talk from CppCon 2020.

At the bottom of this post, I will put some more video links if you want to know more about this subject.


Spring.Benchmark is a standalone project which does not require the Spring library but is one of multiple projects planned under the Spring4D name. It is a very accurate port of the C++ code from Google Benchmark and thus will be familiar to those that might have used the C++ library before.

But now let's dive into benchmarking some code. We will measure sorting and compare TArray.Sort from the RTL which uses plain QuickSort internally to the implementation in Spring which uses a hybrid algorithm called Introsort which uses a combination of different sorting algorithms. While it's certainly interesting to see the difference between those two I want to show you the features of Spring.Benchmark with this example.

I will run all tests with Delphi 10.4.2 and use the Win32 platform with Release config. The tests will run on an i5-3570K at 3.40GHz.

Here is the complete listing of our little benchmark program:

program QuickSortBenchmark;

{$APPTYPE CONSOLE}

uses
  Generics.Collections,
  Generics.Defaults,
  Spring,
  Spring.Benchmark;

type
  TSortProc = procedure (var Values: array of Integer);

procedure Sort(const state: TState; const sort: TSortProc);
var
  n, i: Integer;
  numbers: TArray<Integer>;
begin
  n := state[0];
  SetLength(numbers, n);

  for var _ in state do
  begin
    state.PauseTiming;
    for i := 0 to High(numbers) do
      numbers[i] := Random(MaxInt);
    state.ResumeTiming;
    sort(numbers);
  end;

  state.SetItemsProcessed(n * state.Iterations);
end;

procedure QuickSort(const state: TState);
begin
  Sort(state, Generics.Collections.TArray.Sort<Integer>);
end;

procedure IntroSort(const state: TState);
begin
  Sort(state, Spring.TArray.Sort<Integer>);
end;

begin
  Benchmark(QuickSort, 'quicksort')
    .RangeMultiplier(10)
    .Range(10, 100000);

  Benchmark(IntroSort, 'introsort')
    .RangeMultiplier(10)
    .Range(10, 100000);

  Benchmark_Main();
end.

The library consists of just one unit: Spring.Benchmark.pas. Put that into your uses and you are ready to go.

Every benchmark procedure has to have the signature like our procedures QuickSort and IntroSort have, they take a single parameter of type TState. This variable carries the state of the current benchmark run. Since we have two cases with exactly the same code we put that into our Sort procedure which takes a callback that gets either passed the RTL or the Spring TArray.Sort method.

Now let's take a closer look at our actual benchmark. First, we want to do some setup - in this benchmark, we will do the setup every time it is being run. It depends on the nature of the benchmarked code if that needs to be done every time or if you can do this once and then run the benchmark multiple times. Our state variable carries amongst many other things the parameters for the test in our case we have one for the number of elements we want to test with. We can access those parameters via the square brackets and their index.

Now for the actual benchmark loop - this is done with a for-in loop over our state variable. I am using the inline variable syntax here, the _ is a common notation for a variable whose value is actually of no interest. In fact the type of this variable - its type is TState.TValue in case you cannot use the inline variable syntax - is an empty record with no fields whatsoever. This interestingly allows for quite some optimized code being emitted for this loop - especially in 10.4, where due to using the new Finalize operator the end of the loop is not in the way of the loop body code.

Inside the loop, we do two things: we initialize the array with random numbers every time and then we call Sort. Doing the for-in loop over the state variable automatically starts the internal clock to measure the time. However, since we don't want to include the randomization of our array we wrap this loop inside PauseTiming and ResumeTiming calls.

The library itself decides how many iterations it will do - it will perform some startup code until its duration stabilize and then starts the iterations that it measures.

Let's now look at the last part of the code which is the setup. It always starts with a call to Benchmark where you pass a procedure that takes a TState parameter and a name for this benchmark to identify it when displaying or when filtering. There are several methods to be called to set up every benchmark. We are using the Range method to provide several values in a convenient way. In combination with RangeMultiplier, it determines which parameter values to call the benchmark with - in our case the benchmark will be called with 10, 100, 1000, 10000, and 100000. You can find more about all the possibilities in the documentation.

Let's run the project and see what it shows:


You can see a nicely printed summary of our multiple runs with their timings and the actual number of iterations the library ran the code for. In our code we added the value for a so-called counter which also helps to evaluate the code we just benchmarked - we counted the items that we processed by our sorting by multiplying the numbers in the array by the number of iterations we ran the code. The library code does all the necessary calculations to show that we processed several million items per second with our sorting.

There are many more features such as writing the statistics to csv or json format, running your benchmark code in multiple threads to also measure its performance when running in parallel.

The library requires at least Delphi XE7 or FPC 3.2.0 (at least that is what I tested it with) and runs on Windows (Delphi and FPC) and Linux (only tested with Delphi 10.4). Delphi support for macOS, iOS and Android is being worked on. 


Earlier I promised some more interesting videos to watch and here are a few:

An interesting and very entertaining talk from Andrei Alexandrescu from CppCon 2019.

Two talks from Chandler Carruth about efficiency with algorithms and about benchmarks.


Wednesday, April 28, 2021

TestInsight 1.2 released

Finally! Thanks to Wagner Landgraf who implemented this feature you can now enjoy the hierarchical view of your unit tests just like you know it from the good ol' DUnit GUI.

Here is how it looks in TestInsight in the "by fixtures" view - remember you can toggle between the "by type" view and this one at any time just by clicking that notepad icon.


Not only does it look nicer than the old DUnit GUI, but it also executes the tests way faster and allows you to directly navigate to the source of any of your tests with a simple double click on them, now even if you inherited that test from a base class - you will always end up in the correct method. And all that directly from within the IDE as you know it.

Wagner also implemented support for running DUnit tests with TestInsight on pas2js - I wonder why that might be... 😏

We also improved the way tests are selected when a DUnit project runs - it now simply iterates the entire tree of tests and marks those that you selected in the IDE to then just let them run instead of relying on the ShouldRun method from the listener interface which also made it possible to properly use test decorators without them being run even if there were no tests selected for them.

The new view is not only supported for DUnit though but also for DUnitX and DUnit2.

By the way - please remember: the "fast forward" icon has two functions. When no tests are selected it runs a "discover" which means doing a quick project run but just collect which tests are there without executing them. If any tests have a checkbox, then it executes just those but still collects all other tests inside the project. And via the context menu, you can quickly run the currently focused test or the entire branch without changing any checkboxes.

TestInsight supports any Delphi version from XE and newer - always the latest update on each major version.
You can download the setup here.

Thanks again Wagner - was a pleasure to work with you on this release.

Thursday, April 15, 2021

A guide on successful open source collaboration

You are sharing your source with others or you want to contribute to an open-source project? This is great!


Let's talk about a few points to ensure this will be an enjoyable experience for everyone.


Setting things up

First things first: If you maintain a git repository please add an appropriate .gitignore and a .gitattributes file.

There are several templates for that and articles explaining them - hence I am not going into detail here. Just one thing: rule those line endings and don't let them rule you by messing up your blue dots in the IDE, garbling your class completion or your project file, or making every second commit a complete mess.

People have different settings in their git on how to deal with line endings and there is no "correct" or "wrong" way, they are just different - that's why smart people invented the .gitattributes file to let the repository decide how line endings should be treated equally for every participant. Add it, possibly clean up any existing wrong line endings and everyone will be happy going forward.


Know the tools

Please learn the tools you are using - if your history looks like Cthulhus tentacles because you don't know how to properly pull rebase you are doing something wrong. This is especially important when you are creating pull/merge requests and the reviewer asks you to fix some things and get the branch up to date for a clean and conflict-free merge. Learn how to interactive rebase and respect the maintainers time by not having them look through your trial and error going back and forth, turning things upside down three times, merging upstream changes in the middle garnished with "fixed conflicts after merge" commits until you finally reached the state you want to submit. Learn how to work with different remotes managing your fork and the original repo in order to keep your fork up to date in a clean way. Again there are guides out there explaining these things in great detail. Please read them.


Respect each other

Divide separate things into own commits, write meaningful commit messages, and if necessary put things into separate pull requests to not throw one big clump at the maintainer making it easier to look through the several things piece by piece. It will also make it easier to address remarks made during the review, produce a better and/or quicker outcome and leave all participants in a good mood.

Stick to the coding style of the maintainer - this includes naming and formatting as well as the usual approach on things in the repository. The codebase uses begin after then instead of in a new line? Then do so as well. They write integer lowercase or String uppercase? Then do so as well. Don't try to sneak your personal style in there if it's in contrast to the existing code. Nothing worse than a patchwork of different coding styles emerging over time the more contributors come together.


These are just some of my recommendations and you might have a different opinion on some things or some details but after being active in open source development for over 15 years I believe following these suggestions will improve collaboration on open source projects for everyone.

If you are not contributing to some open source project yet - then please be encouraged to consider doing so. Start small, maybe you found an issue in some library you are using - find out of it's known yet and report if not. If you already found a fix, consider providing this fix attached to the issue or as a pull/merge request.

Sunday, April 11, 2021

Out parameters are just bad var parameters

After talking about const parameters last time today we take a closer look at out parameters and how they differ from var parameters.

I like the concept of out parameters as they clearly state that only the value that comes back matters and not the value that goes in. However, the Delphi implementation of out parameters has some aspects to it that can cause a decision against them and rather choose a var parameter. As last time we will look at some assembler code that shows what those differences are. Out parameters like var parameters pass a reference to the value rather than the value itself.

The code for this article will be this:
{$APPTYPE CONSOLE}
{$O+,W-}
type
  TTestType = ...;

procedure C(z: TTestType);
begin
end;

procedure A(var y: TTestType);
begin
  y := Default(TTestType);
end;

procedure B(out y: TTestType);
begin
  y := Default(TTestType);
end;

procedure Main;
var
  x: TTestType;
begin
  A(x);
  B(x);
end;
Like last time, we will inspect the code for different types for TTestType and see how it differs. Let's start with Integer - the code we will see for the calls and inside A and B are as follows:
OutParams.dpr.24: A(x);
00408FA5 8BC4             mov eax,esp
00408FA7 E8E8FFFFFF       call A
OutParams.dpr.25: B(x);
00408FAC 8BC4             mov eax,esp
00408FAE E8E9FFFFFF       call B
OutParams.dpr.12: y := Default(TTestType);
00408F94 33D2             xor edx,edx
00408F96 8910             mov [eax],edx
OutParams.dpr.13: end;
00408F98 C3               ret
OutParams.dpr.17: y := Default(TTestType);
00408F9C 33D2             xor edx,edx
00408F9E 8910             mov [eax],edx
OutParams.dpr.18: end;
00408FA0 C3               ret
Nothing really fancy here - esp is the address of the local variable x. The (unfortunately still undocumented) intrinsic function Default() takes care of setting the parameter to the default value of the given type - so in this case 0. The code for the var parameter will look exactly the same. For other types, the code will look similar but something interesting happens when we use a managed type such as string. Take a look at how this changes the code being generated:
OutParams.dpr.24: A(x);
00408FCB 8D45FC           lea eax,[ebp-$04]
00408FCE E8C1FFFFFF       call A
OutParams.dpr.25: B(x);
00408FD3 8D45FC           lea eax,[ebp-$04]
00408FD6 E8F1CEFFFF       call @UStrClr
00408FDB E8C0FFFFFF       call B
On the caller side, we now see a call to System._UStrClr which the compiler inserted here to ensure that x will be empty before being passed to A. Out parameters are always initialized before they are passed, unlike var parameters. When we will take a look at the code inside A we will see nothing unusual except a lack of optimization. eax could directly be passed to System._UStrClr - and that is not a result of using Default() but also happens when assigning '' to y:
OutParams.dpr.11: begin
00408F94 53               push ebx
00408F95 8BD8             mov ebx,eax
OutParams.dpr.12: y := Default(TTestType);
00408F97 8BC3             mov eax,ebx
00408F99 E82ECFFFFF       call @UStrClr
OutParams.dpr.13: end;
00408F9E 5B               pop ebx
00408F9F C3               ret
The interesting difference however will be obvious when we will look into B:
OutParams.dpr.16: begin
00408FA0 55               push ebp
00408FA1 8BEC             mov ebp,esp
00408FA3 53               push ebx
00408FA4 8BD8             mov ebx,eax
00408FA6 85DB             test ebx,ebx
00408FA8 7404             jz $00408fae
00408FAA 33C0             xor eax,eax
00408FAC 8903             mov [ebx],eax
OutParams.dpr.17: y := Default(TTestType);
00408FAE 8BC3             mov eax,ebx
00408FB0 E817CFFFFF       call @UStrClr
OutParams.dpr.18: end;
00408FB5 5B               pop ebx
00408FB6 5D               pop ebp
00408FB7 C3               ret
What is going on here? The first two instructions are setting up a frame pointer which is usual but would not be necessary in this case - especially since we turned off that option. The following lines basically ensure that our y parameter really is empty - again with a lack of optimization.

Why is this happening? The caller side ensured that y is empty. This code is for C++Builder compatibility! C++ does not have the concept of out parameter but just by reference parameter which equals the var parameter in Delphi. And because of that when C++ would call such a routine the value would not have been initialized. Unfortunately, at least to my knowledge, there is no option to turn this off because our code will never be called from C++. We have built an executable here in Delphi; our function is not exported nor did we make a DLL. When using out parameters you pay a price for some most likely unused feature as most if not all Delphi code you ever write will never be called from any C++ code. The impact of out parameters is so significant in some cases that in 10.4 some of them were changed to var in the RTL - take a look at most parameters of TValue in the unit System.Rtti. Because for records this overhead can be even bigger and even more when they are passed multiple levels of out parameters because every call and routine again produces this completely unnecessary overhead.

The entire concept of out parameters to me looks completely unfinished - let's for a second take a look at some C# code which also has out parameters
static void B(out int y)
{
    WriteLine(y);
}
This code will raise two errors:
Error	CS0269	Use of unassigned out parameter 'y'
Error	CS0177	The out parameter 'y' must be assigned to before control leaves the current method
And the compiler is right - since the parameter is out the value going in actually is undefined behavior - and if the compiler ensures that it cannot be used then it also does not need to do any initialization ensuring any value. That means no unnecessary work to do and no inconsistent behavior - remember unmanaged data types don't get that extra treatment, whatever value is in an int variable being passed is still in there when being passed to an out parameter.
Second, the compiler ensures setting a value to the out parameter ensuring it is not undefined when returning from this routine. Would an exception occur during the invocation of that routine and before the out parameter was set then upon returning and catching the exception the variable would still contain the value it had before - a totally sane and understandable behavior.

As for me - I will be more careful where I use out parameters and in fact, during the refactoring of the collections in Spring4D, I replaced most out parameters with var parameters. Since even without the compiler enforcing this, all code paths inside those methods eventually set the value of the parameter it will be no change in behavior for you but avoid this completely insane overhead.

Saturday, March 27, 2021

How to hide the CodeInsight status panel

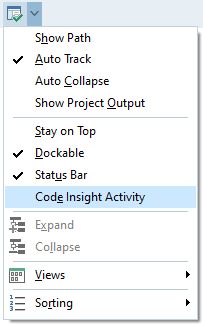
The new CodeInsight status panel added in 10.4.2 can be very distracting with its busy progressbar. Unfortunately there is no builtin mechanism to hide it but doing so is very easy.

Edit: Apparently as Lachlan pointed out on the comments I totally missed the "Code Insight Activity" toggle in the Options dropdown of the Project manager toolbar:


I leave the obsolete way here for documentation - here is the code to add a toggle button to the projectmanager toolbar (adding an icon is left as an excersise to the reader):

unit ToggleLSPStatusPanel;

interface

procedure Register;

implementation

uses
  System.Classes,
  Vcl.Forms,
  Vcl.ComCtrls,
  Vcl.ExtCtrls;

var
  LSPPanel: TPanel;
  ToolButton: TToolButton;

procedure TogglePanel(instance: TObject; Sender: TObject);
begin
  LSPPanel.Visible := not LSPPanel.Visible;
end;

procedure Register;
var
  e: TNotifyEvent;
begin
  var projectManagerForm := Application.MainForm.FindComponent('ProjectManagerForm');
  var toolBar := TToolBar(projectManagerForm.FindComponent('Toolbar'));
  ToolButton := TToolButton.Create(nil);
  LSPPanel := TPanel(projectManagerForm.FindComponent('pLSPStatus'));
  ToolButton.Left := toolbar.Width;
  ToolButton.Parent := toolbar;
  TMethod(e).Data := nil;
  TMethod(e).Code := @TogglePanel;
  ToolButton.OnClick := e;
end;

initialization

finalization
  try
    ToolButton.Free;
  except 
    // simply swallow the exception when closing the IDE as 
    // it will already have destroyed the button
    // feel free to make this more robust
  end;

end.

Simply add this unit to a designtime package and install it. Enjoy!

Thursday, March 25, 2021

Introducing Delphi Uses Helper

I just wanted to share a small IDE plugin I wrote some time ago which helps adding units to your uses clause and/or navigating through code without having to rely on the faulty "Find declaration" feature.


Installation and configuration

After installation go to Tools->Options in the IDE and then to Third Party->UsesHelper (or just hit F6, type "UsesHelper" and hit Enter)

Add any directories whose source you want to have indexed (recursively) and add directories that should be excluded from the indexing - one directory per line, no extra separators. Variables are supported like they are in other places in the IDE such as library path - as you can see with the already present entry for the Delphi sources.

Under "Unit scope names" you can add those unit scopes you want to omit when adding units to the uses clause - so if you for example like me write code that has to work with versions before XE2 this might be handy to add just Classes rather than System.Classes.

If any changes were made it will automatically start indexing the source upon hitting save - indexing will only happen at that point or when you hit the button, not on starting the IDE or at any other point (I may add this at some point in the future).


Supported versions: XE and higher


What it does internally

Indexed are: types, consts, global variables, routines, enums - did I miss anything? Well, basically everything inside the interface section of every unit it finds.

For the parsing of the files DelphiAST is being used. Any errors that might occur are being printed out in the messages panel - I am not giving support for any source code that might not be parsed properly - if you have some issue please verify it with the demo project coming with DelphiAST and report the issue over there. Also be aware that parsing might fail if you have units that are littered with custom compiler defines as the parsing mechanism is not aware of them - it just operates with the defines that DelphiAST uses (which are those of a standard Win32 application).

Indexing may take a while - it will print out when it's done.

The index is being stored in a file per Delphi version you have the plugin installed in (the settings are also per Delphi version) that is stored in the installation directory which is %localappdata%\programs\useshelper but loaded into memory by the plugin. Additionally it will index files within the currently opened project on the fly when being invoked.

Exception: System and SysInit are not being indexed as you cannot add those units to uses clause anyway but this will avoid navigating to any identifier in those units.


Format of the index.dat

If you fancy you can write that file yourself - the format is fairly simple:

<symbolname>=<unitname>|<int32> - the upper 8bit of that number are the column and the lower 24bit are the line number


Now lets try it out

When you are in the code and have the caret on some identifier you can hit Ctrl+Shift+A - which usually invokes a similar but way worse feature of the IDE - or whatever hotkey you set this to.

You will see list of units where this identifier is found in - the match has to be exact, no fuzzy matching, no guessing. It you type TSrtingList it won't find anything I guess. (implementing any kind of more sophisticated search is not planned)

Now you can navigate with the up/down keys if there are multiple units to chose from or switch between interface/implementation with the left/right keys (it currently does not detect in which section you currently are to make a best guess).

If you then hit enter the unit will get added to the appropriate uses clause - it will get added at the end and it will in a new line - no configuration to control that behavior and I will not go into the mess of doing so.

If you hit Shift+Enter the unit you selected will be opened and you will navigate to the declaration. This works even if you have no project open which "find declaration" does not.

Yes, the dialog is modal - leaving it without doing anything only works with the Esc key at this point.

Currently moving a unit between interface and implementation is not supported.


Anyhow enjoy free stuff as some selected people and me did for quite a while now and don't pester me with feature requests. ;)


Download here